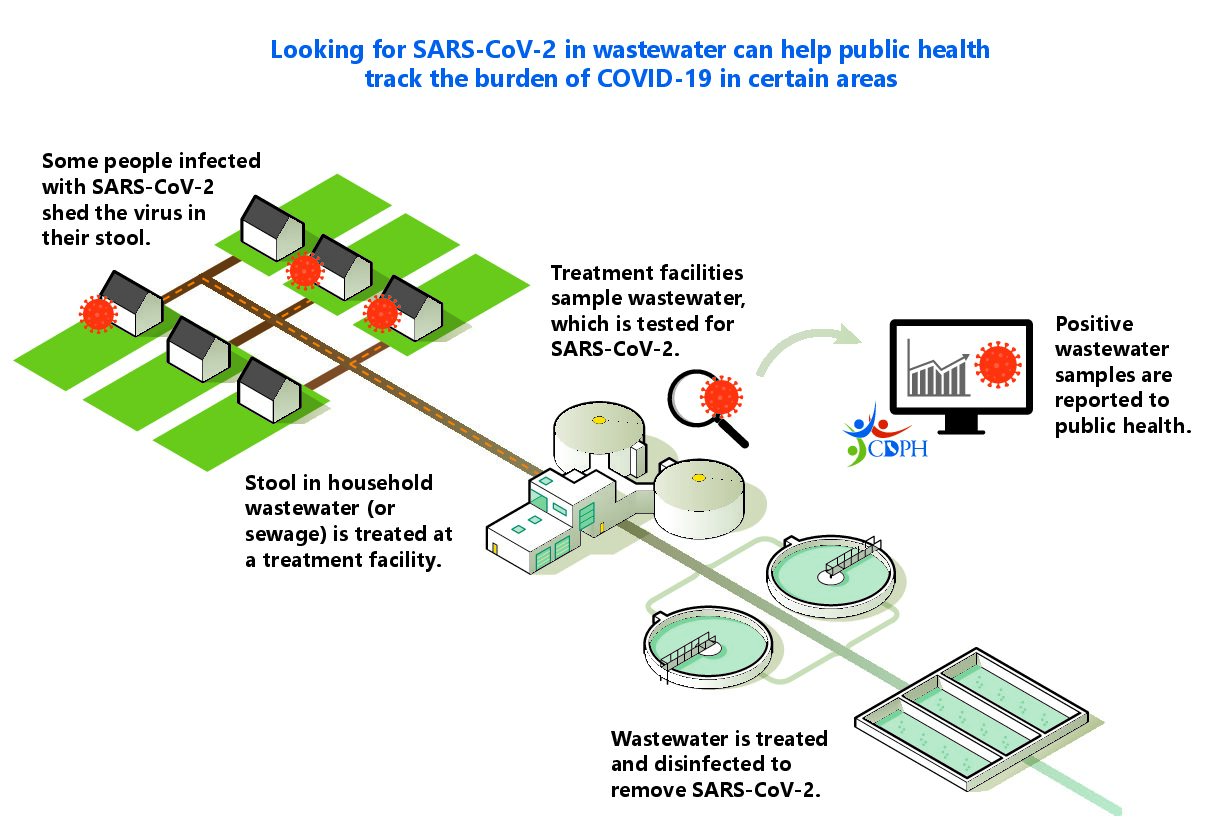
In last week’s article, we discussed the evolution of wastewater surveillance for virus detection. This week, we follow that up with a discussion of what the data are showing. As stated by CDC, wastewater surveillance data are primarily used in three ways: monitoring for presence of infection within a community; tracking trends in infection within a community; and screening for infections at a targeted site (e.g., building or facility) to trigger additional individual-based testing and mitigation measures. A summary of the process is shown in the CDPH graphic above.
Validating the applicability of wastewater surveillance as an infectious disease predictor, a study by Stanford University, based on a time series analysis of 268 counties in 22 states from January to September 2022, showed that SARS-CoV-2 wastewater metrics accurately reflected high clinical rates of disease early in 2022, with the association declining over time as home testing and vaccination increased. Such studies are showing that wastewater surveillance may be the best marker of COVID presence in a community.
Thus, wastewater surveillance is proving to be a reliable tool for predictive and trend analytics, as shown by a study by Stanford’s Sewer Coronavirus Alert Network (SCAN). By identifying parts of viral genetic material that are shed in human waste and measuring their concentrations, the university had been using the data to track COVID. With SCAN data now being used to track other infectious diseases as well, COVID-19, influenza type A, norovirus, and respiratory syncytial virus (RSV) are all showing increased activity, with Influenza A at its highest concentration since April. Information like this allows for development and communication of the best risk management measures by entities such as health departments and medical providers.
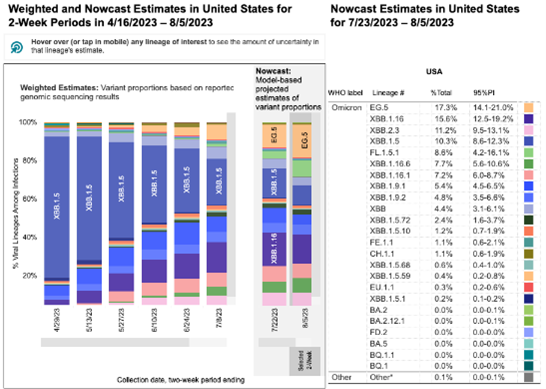
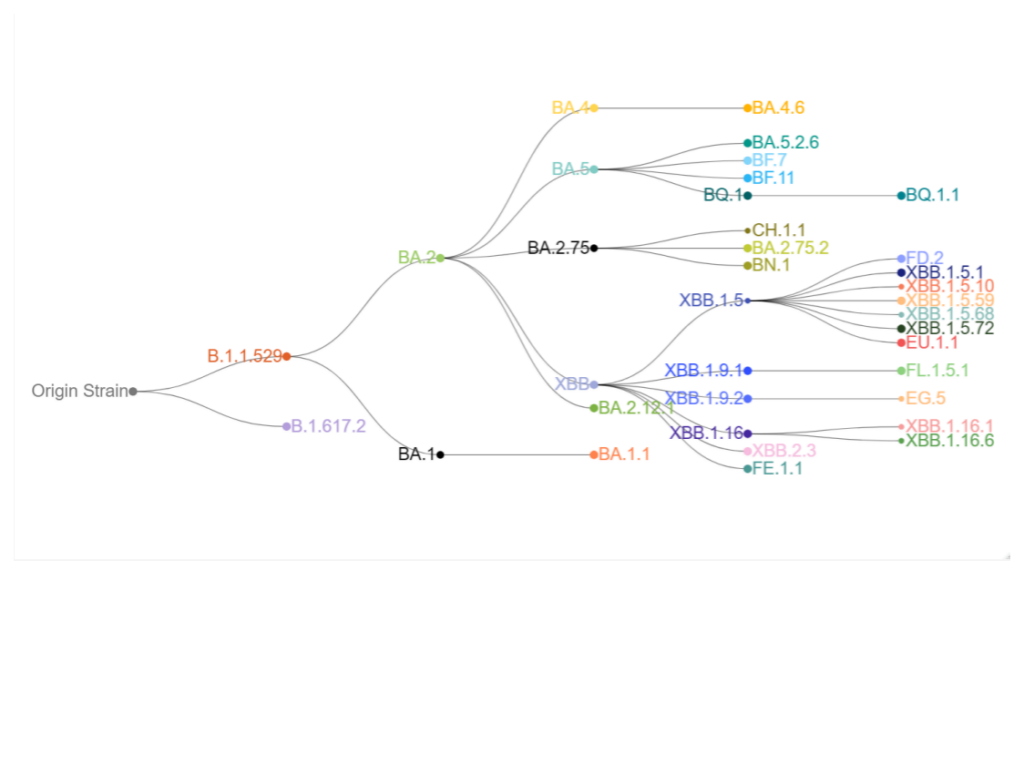
Some limitations do remain, such as in predicting specific numbers of cases, capturing low levels of infection, and providing detailed information about how and where outbreaks occur. But it is an “unbiased measure of disease prevalence in a sewershed.” Not only can the surveillance assess prevalence of a virus, but it can also track which variants are predominant and emerging. This can be particularly useful when combined with genomic surveillance conducted by CDC. For example, the CDC data shows that the COVID variant EG.5 (which is related to upcoming vaccine strain XBB.1.5) is the strongest evolving variant, as depicted in the graphs below.
Wastewater surveillance is transforming local efforts into a robust national surveillance system.
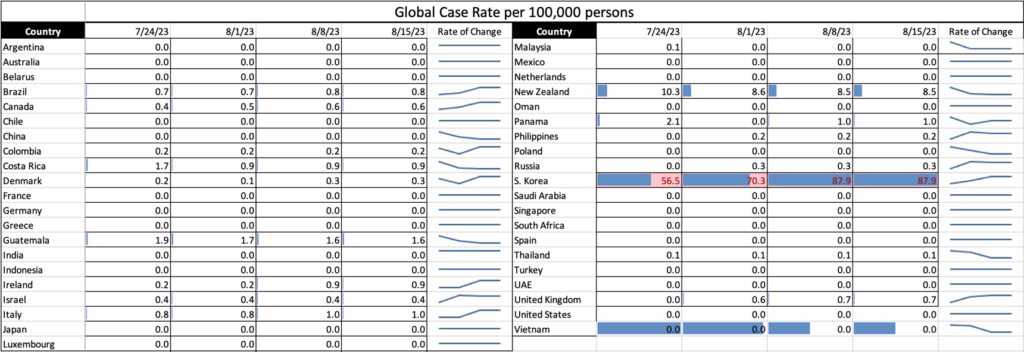
COVID Risk Matrix:
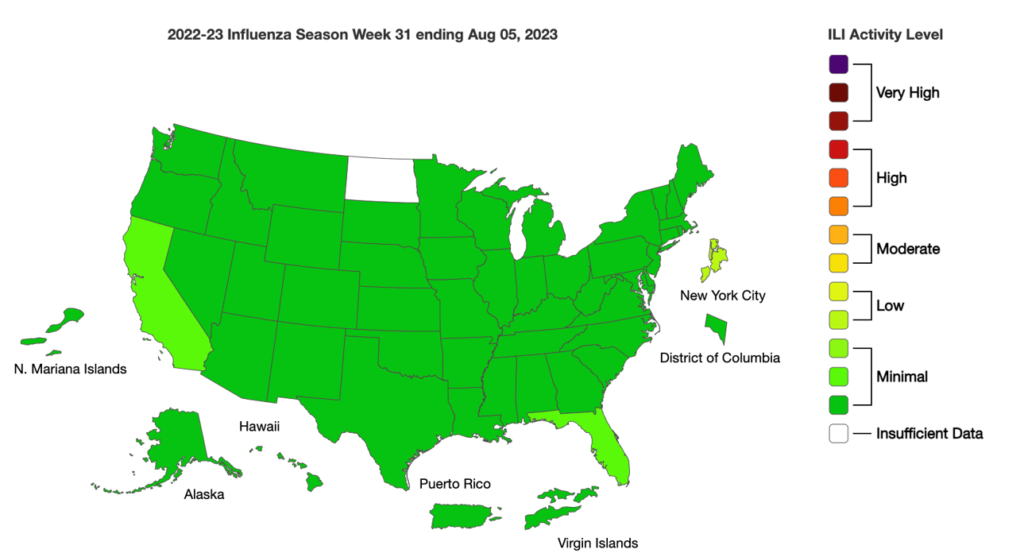
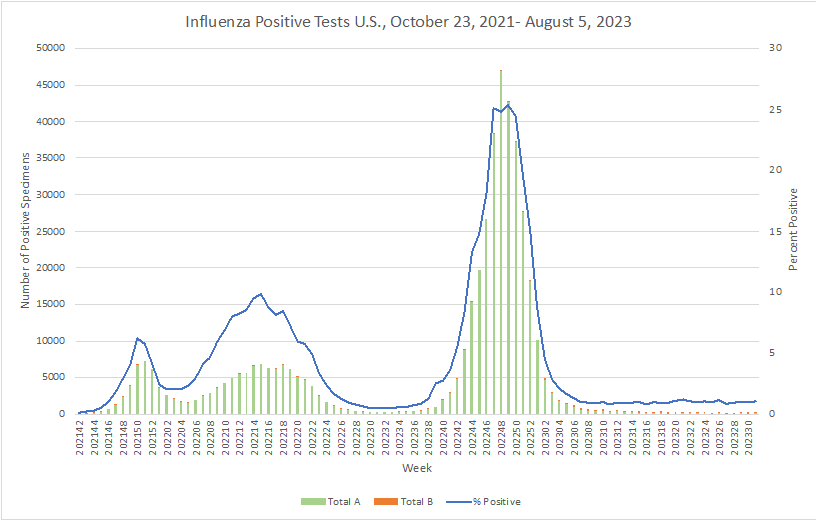
Influenza:
Infectious Disease News:
- A new study from Canada shows that during March 2023, three-fourths of Canadians had antibodies from SARS-CoV-2 infections. The individuals with detectable antibodies had previously been infected or received the vaccine. Experts continue to warn that seniors remain at highest risk of severe outcomes even if they have been vaccinated.
- In Ukraine, epidemics are being reported. These include hepatitis A and cholera likely from polluted drinking water and measles due to lower vaccination rates.
- Newly published research indicates that having COVID shots in the same arm may elicit a better immune response. Further research needs to be done to confirm the findings from the study, said the authors.
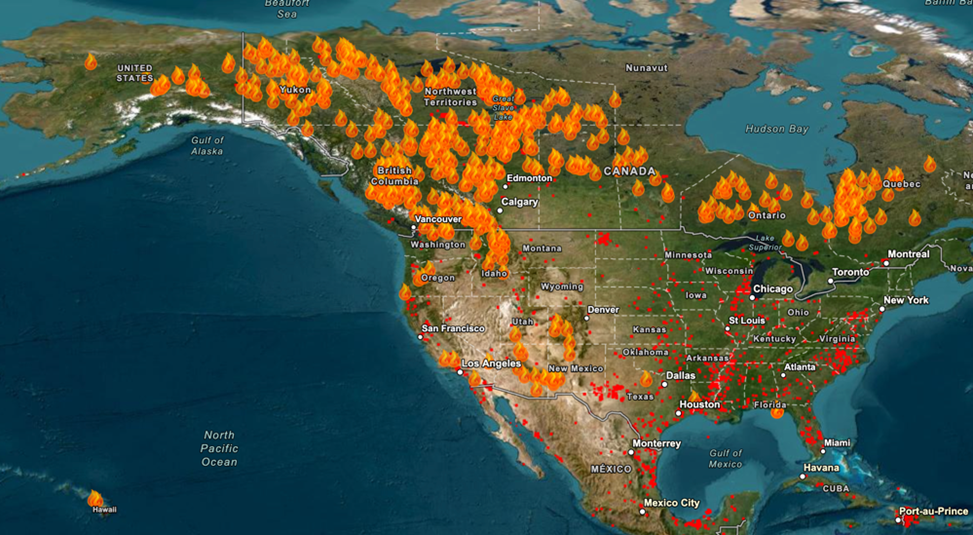
- Around the Western regions of North America, during the summer you often smell, see or hear of wildfires. To address the health impacts from the large wildfire in Hawaii that displaced many families, the US Department of Health and Human Services declared a Public Health Emergency. Additionally, President Biden made a major disaster declaration. To see where current wildfires are burning throughout North America, view this map: